Network Rail NW&C Structural Examination Optimisation
Network Rail
Programme Management, Data Science and Software Engineering for Network Rail's NW&C Structural Examination Team
Network Rail’s NW&C structural examination team is responsible for inspecting thousands of railway assets such as bridges, retaining walls, and other structures across a region stretching from Cumbria to London.
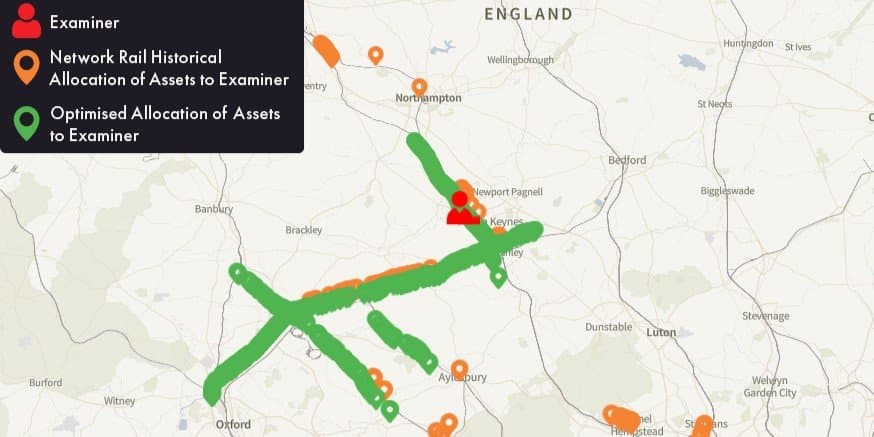
Historically, examiner-to-asset allocation relied on regional teams' localised knowledge and planning, rather than data-driven planning, resulting in examiners routinely travelling long distances to assets that could have been inspected by closer examiners.
In CP7 Year 1 (FY 2024/25) examiners were spending a disproportionate share of their working day behind the wheel rather than conducting inspections, causing high driving costs and low levels of productivity. Under mounting CP7 budget pressures and growing regulatory compliance demands, Network Rail needed a step-change in how examination portfolios were planned and resourced.
Network Rail commissioned us to apply its proprietary optimisation engine to the NW&C examination portfolio.
We assembled a multidisciplinary team combining programme management, data science and software engineering capability to deliver 2 key outputs:
- A validated like-for-like comparison against CP7 Year 1 actuals, providing objective proof of the algorithm's effectiveness.
- A fully optimised CP7 Year 3 (FY 2026/27) schedule covering all visual, detailed and generic assets across 87 examiners.
The project began with upfront requirements definition, the establishment of agreed User Acceptance Testing (UAT) criteria, and data validation and cleansing with Network Rail.
We then ran the cleansed data through our optimisation model, which combined geographic proximity-based asset-to-examiner allocation with Travelling Salesman Problem (TSP) sequence optimisation and enhanced Google-Maps-style road-network routing to determine the most efficient inspection order. The model balanced workloads within the agreed 75–91% utilisation band, respected 7-hour working-day constraints, and incorporated client-driven refinements throughout multiple feedback sessions.
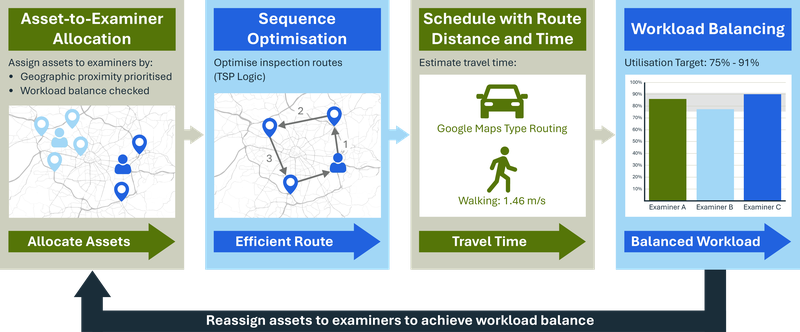
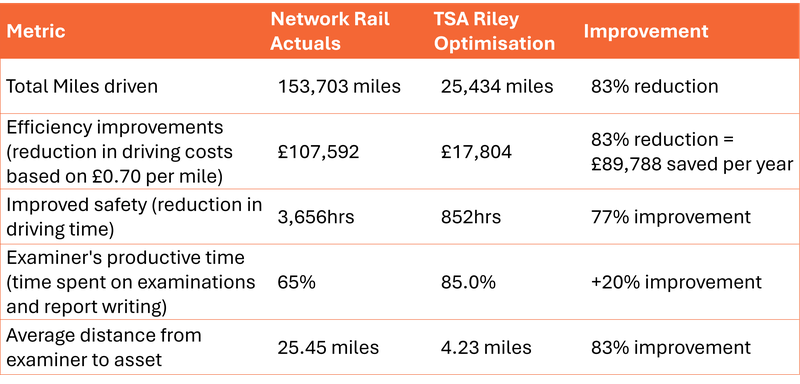
Table 1 summarises the CP7 Year 1 actuals for the 6832 visual assets vs our optimised solution, demonstrating objective proof of the model.
Our optimisation model was then applied to Network Rail's CP7 Year 3 (FY 2026/27) full asset list which included 13,002 visual, 25,920 generic and 1,558 detailed inspection (total number of assets 40,480). Based on the modelling assumptions and data provided, this showed all assets could be inspected, productivity levels at 88.73% and zero instances of examiner workdays exceeding their 7hr day.
In CP7 Year 3, the optimised schedule results in a driving distance of 77,438 miles. Assuming the same 83% improvement seen in the CP7 Year 1 comparison is achieved again in CP7 Year 3, the original (unoptimised) driving distance would have been 455,517 miles. This equates to an annual saving of £264,655 in driving costs alone, before accounting for the additional benefits of removing non-compliances by inspecting all assets, and the safety and sustainability gains from reduced driving. Against the cost of the project, this delivers a 2.6x financial return on investment in NW&C, providing a clear, evidence-based case for rolling out optimisation to other regions, particularly those with geographically dispersed portfolios where inefficient driving has an even greater proportional impact.